Greeks Visualizer
A Streamlit dashboard for option pricing and all five Greeks: Delta, Gamma, Vega, Theta, and Rho.
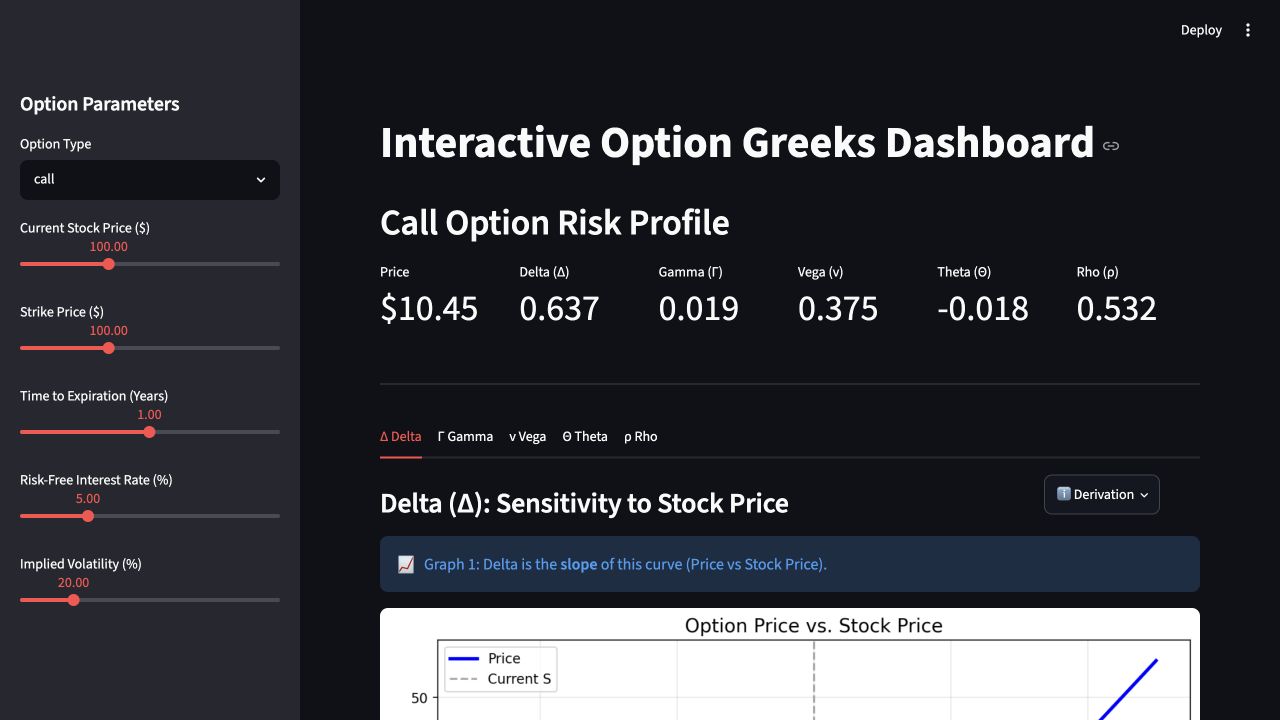
Interactive preview
Delta & Gamma
Educational modelModel assumptions
European exercise · no dividends
Strike $100 · annual rate 4%
Hypothetical inputs. No market data.
- Model price
- $11.84
- Delta
- 0.612
- Gamma
- 0.015
Delta (per $1 underlying move)Underlying price ($)
- Delta
View chart data
| Underlying price ($) | Delta |
|---|---|
| 70 | 0.1268 |
| 71 | 0.139 |
| 72 | 0.1517 |
| 73 | 0.1651 |
| 74 | 0.1789 |
| 75 | 0.1933 |
| 76 | 0.2082 |
| 77 | 0.2235 |
| 78 | 0.2392 |
| 79 | 0.2553 |
| 80 | 0.2717 |
| 81 | 0.2885 |
| 82 | 0.3054 |
| 83 | 0.3226 |
| 84 | 0.34 |
| 85 | 0.3575 |
| 86 | 0.3751 |
| 87 | 0.3928 |
| 88 | 0.4105 |
| 89 | 0.4281 |
| 90 | 0.4457 |
| 91 | 0.4633 |
| 92 | 0.4806 |
| 93 | 0.4979 |
| 94 | 0.515 |
| 95 | 0.5318 |
| 96 | 0.5484 |
| 97 | 0.5648 |
| 98 | 0.5809 |
| 99 | 0.5967 |
| 100 | 0.6122 |
| 101 | 0.6273 |
| 102 | 0.6421 |
| 103 | 0.6566 |
| 104 | 0.6707 |
| 105 | 0.6844 |
| 106 | 0.6978 |
| 107 | 0.7108 |
| 108 | 0.7234 |
| 109 | 0.7356 |
| 110 | 0.7474 |
| 111 | 0.7588 |
| 112 | 0.7698 |
| 113 | 0.7805 |
| 114 | 0.7908 |
| 115 | 0.8007 |
| 116 | 0.8102 |
| 117 | 0.8194 |
| 118 | 0.8282 |
| 119 | 0.8367 |
| 120 | 0.8448 |
| 121 | 0.8526 |
| 122 | 0.86 |
| 123 | 0.8672 |
| 124 | 0.874 |
| 125 | 0.8805 |
| 126 | 0.8868 |
| 127 | 0.8927 |
| 128 | 0.8984 |
| 129 | 0.9038 |
| 130 | 0.909 |