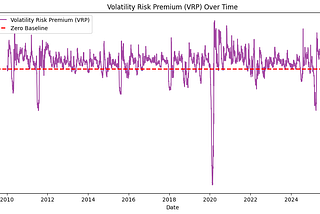
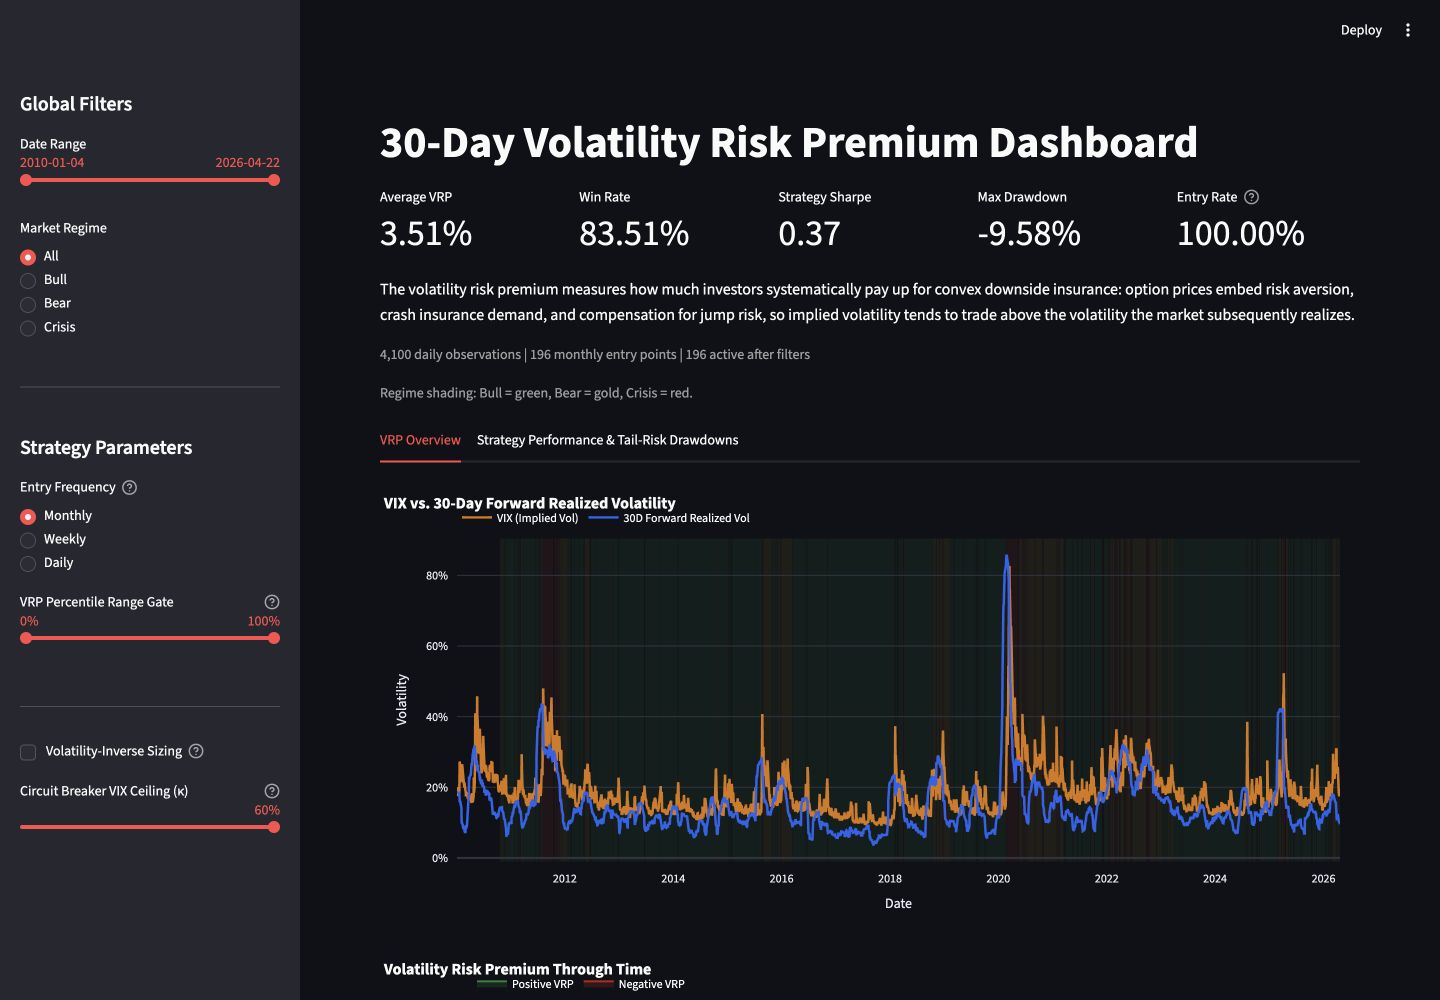
196 monthly observations, 2010-01-29 to 2026-04-22. At the last observation, VIX was 18.92% and forward realized volatility was 9.58%.View chart data +
Annualized volatility (%) by monthly observation date
Monthly observation date
VIX
Forward realized volatility
2010-01-29
24.62
15
2010-02-26
19.5
7.39
2010-03-31
17.59
23.06
2010-04-30
22.05
31.3
2010-05-28
32.07
24.68
2010-06-30
34.54
20.22
2010-07-30
23.5
19
2010-08-31
26.05
14.64
2010-09-30
23.7
11.45
2010-10-29
21.2
14.3
2010-11-30
23.54
8.51
2010-12-31
17.75
10
2011-01-31
19.53
14.43
2011-02-28
18.35
14.47
2011-03-31
17.74
9.74
2011-04-29
14.75
12.48
2011-05-31
15.45
16.21
2011-06-30
16.52
36.74
2011-07-29
25.25
43.48
2011-08-31
31.62
29.85
2011-09-30
42.96
30.05
2011-10-31
29.96
27.64
2011-11-30
27.8
16.35
2011-12-30
23.4
8.69
2012-01-31
19.44
10.55
2012-02-29
18.43
13.14
2012-03-30
15.5
13.54
2012-04-30
17.15
15.99
2012-05-31
24.06
18.44
2012-06-29
17.08
13.08
2012-07-31
18.93
9.98
2012-08-31
17.47
10.67
2012-09-28
15.73
12.77
2012-10-31
18.6
13.31
2012-11-30
15.87
12.24
2012-12-31
18.02
9.93
2013-01-31
14.28
10.97
2013-02-28
15.51
8.44
2013-03-28
12.7
13.19
2013-04-30
13.52
12.08
2013-05-31
16.3
15.14
2013-06-28
16.86
7.51
2013-07-31
13.45
10.27
2013-08-30
17.01
11.39
2013-09-30
16.6
12.29
2013-10-31
13.75
9.13
2013-11-29
13.7
9.92
2013-12-31
13.72
14.41
2014-01-31
18.41
12.34
2014-02-28
14
12.68
2014-03-31
13.88
11.72
2014-04-30
13.41
7.62
2014-05-30
11.4
6.33
2014-06-30
11.57
10.54
2014-07-31
16.95
7.51
2014-08-29
12.09
14.01
2014-09-30
16.31
16.07
2014-10-31
14.03
8.85
2014-11-28
13.33
16.09
2014-12-31
19.2
16.04
2015-01-30
20.97
12.21
2015-02-27
13.34
12.76
2015-03-31
15.29
9.71
2015-04-30
14.55
10.25
2015-05-29
13.84
12.22
2015-06-30
18.23
11.42
2015-07-31
12.12
26.44
2015-08-31
28.43
20.44
2015-09-30
24.5
12.04
2015-10-30
15.07
14.77
2015-11-30
16.13
19.44
2015-12-31
18.21
22.58
2016-01-29
20.2
17.6
2016-02-29
20.55
11.91
2016-03-31
13.95
10.41
2016-04-29
15.7
10.21
2016-05-31
14.19
16.81
2016-06-30
15.63
7.09
2016-07-29
11.87
9.94
2016-08-31
13.42
12.95
2016-09-30
13.29
9.78
2016-10-31
17.06
9.78
2016-11-30
13.33
7.4
2016-12-30
14.04
6.03
2017-01-31
11.99
6.52
2017-02-28
12.92
7.18
2017-03-31
12.37
6.14
2017-04-28
10.82
7.1
2017-05-31
10.41
7.43
2017-06-30
11.18
7.14
2017-07-31
10.26
9.11
2017-08-31
10.59
5.03
2017-09-29
9.51
4.45
2017-10-31
10.18
5.8
2017-11-30
11.28
6.29
2017-12-29
11.04
21.23
2018-01-31
13.54
23.18
2018-02-28
19.85
20.77
2018-03-29
19.97
15.49
2018-04-30
15.93
9.58
2018-05-31
15.43
9.23
2018-06-29
16.09
8.03
2018-07-31
12.83
6.56
2018-08-31
12.86
13.29
2018-09-28
12.12
21.5
2018-10-31
21.23
20.71
2018-11-30
18.07
27.61
2018-12-31
25.42
16.21
2019-01-31
16.57
9.04
2019-02-28
14.78
10.54
2019-03-29
13.71
11.2
2019-04-30
13.12
14.83
2019-05-31
18.71
9.21
2019-06-28
15.08
14.26
2019-07-31
16.12
20.36
2019-08-30
18.98
12.67
2019-09-30
16.24
11.78
2019-10-31
13.22
7.11
2019-11-29
12.62
7.81
2019-12-31
13.78
11.8
2020-01-31
18.84
67.98
2020-02-28
40.11
85.14
2020-03-31
53.54
37.1
2020-04-30
34.15
28.02
2020-05-29
27.51
26.49
2020-06-30
30.43
12.38
2020-07-31
24.46
18.64
2020-08-31
26.41
23.49
2020-09-30
26.37
21.02
2020-10-30
38.02
14.34
2020-11-30
20.57
10.16
2020-12-31
22.75
15.28
2021-01-29
33.09
16.46
2021-02-26
27.95
15.21
2021-03-31
19.4
13.14
2021-04-30
18.61
11.85
2021-05-28
16.76
8.74
2021-06-30
15.83
10.33
2021-07-30
18.24
7.82
2021-08-31
16.48
12.94
2021-09-30
23.14
9.87
2021-10-29
16.26
14.86
2021-11-30
27.19
16.13
2021-12-31
17.22
19.45
2022-01-31
24.83
23.86
2022-02-28
30.15
21.62
2022-03-31
20.56
27.52
2022-04-29
33.4
31.5
2022-05-31
26.19
25.78
2022-06-30
28.71
17.91
2022-07-29
21.33
19.19
2022-08-31
25.87
26.51
2022-09-30
31.62
30.29
2022-10-31
25.88
24.73
2022-11-30
20.58
17.85
2022-12-30
21.67
16.28
2023-01-31
19.4
16.5
2023-02-28
20.7
15.98
2023-03-31
18.7
11.97
2023-04-28
15.78
12.38
2023-05-31
17.94
10.09
2023-06-30
13.59
9.09
2023-07-31
13.63
11.31
2023-08-31
13.57
11.51
2023-09-29
17.52
14.8
2023-10-31
18.14
10.45
2023-11-30
12.92
9.75
2023-12-29
12.45
11.44
2024-01-31
14.35
11.8
2024-02-29
13.4
11.32
2024-03-28
13.01
13.02
2024-04-30
15.65
8.7
2024-05-31
12.92
6.89
2024-06-28
12.44
18.43
2024-07-31
16.36
19.29
2024-08-30
15
12.96
2024-09-30
16.73
12.79
2024-10-31
23.16
10.74
2024-11-29
13.51
14.9
2024-12-31
17.35
12.72
2025-01-31
16.43
17.66
2025-02-28
19.63
41.26
2025-03-31
22.28
42.04
2025-04-30
24.7
14.28
2025-05-30
18.57
9.26
2025-06-30
16.73
9.63
2025-07-31
16.72
10.78
2025-08-29
15.36
11.44
2025-09-30
16.28
13.71
2025-10-31
17.44
12.95
2025-11-28
16.35
8.25
2025-12-31
14.95
12.43
2026-01-30
17.44
13.43
2026-02-27
19.86
17.87
2026-03-31
25.25
11
2026-04-22
18.92
9.58
Monthly observations from the project dataset · January 2010–April 2026.